
Pay, Diversity and Retention at The Post
Data Analysis
Pay, Diversity and Retention at The Post
When we set out to conduct this study two years ago, we requested several data sets from The Washington Post. It was our goal to be as comprehensive as possible, examining pay, diversity and retention for every employee at the company, because we know that we are all inextricably linked.
Over time, we asked the company for:
- Raw pay data for all Guild-covered employees, including:
- Years of experience
- Complete salary history
- Job title and department history
- Departures of former bargaining unit employees in the last five years at The Post
- Raw demographic data for all Post employees, including non-Guild managers
Because of language in our union contract, Post management is obligated to give us annual pay data on Guild-covered employees. To protect the privacy of our colleagues, we stripped away their names before analyzing the data. This study examines data from 2016 through mid-2021, a snapshot of the salaries, job titles and demographic information of workers who were employed by The Post at that time. The data also showed when those employees arrived at The Post, and if and when they left — information we used to analyze retention.
The company denied our request for the raw demographic data of all Post employees, including non-Guild managers, saying that the Guild had no legal or contractual right to that information. The Guild acknowledged that was true, but argued that its ability to tell the full story of diversity and retention at The Post would be hindered without demographic data on non-Guild employees.
Again, the company refused our request.
Absent that full, raw data set, the Guild was forced to base its company-wide demographic analysis on a public report released by The Post in the summer of 2021, as part of the organization’s new pledge to publish employee gender and racial/ethnic data on an annual basis. The company did not include its methodology, nor did it provide a key.
The Post’s own demographic report broke down company-wide data into two categories: “all employees” and “leadership.” The Guild asked the company to clarify how it defined its “leadership” category, and Post management said only that “leadership” did not include Guild-covered employees. The company divides the data further by “News and Editorial,” which encompasses all employees in the News and Opinions departments, and “Business,” which includes all other Post staffers. The company’s demographic report includes both Guild and non-Guild workers, including employees and managers on the Engineering and Product teams.
In the interest of transparency, we want to acknowledge that this report is not a top-down analysis of every single Post employee, because the company gave us incomplete data.
Instead, we have produced a comprehensive study of Guild-covered employees, and additional company-wide analysis based on the publicly available demographic data. We indicate where we use each data set throughout this report.
We begin with a topline examination of company-wide demographics and the pay of Guild-covered workers as a group. We then explore The Post’s retention rates among all Guild-covered employees, a first-of-its-kind public audit of our news organization. Finally, we offer separate, granular breakdowns of pay and retention data for Guild-covered workers within the two departments we represent: Newsroom and Commercial.
Each of these sections offer illuminating findings about the work environment for Post employees.
Placed side by side, we see how the company has made some progress toward its goals of cultivating a more inclusive workplace — and how at the same time, a lack of diversity, unequal pay and higher turnover rates for people of color have also held the company back from meeting those goals.
Company-wide overview
Demographics
The company reported in its own demographic report that the organization as a whole — including managerial and Guild-covered employees — is majority-male. As of the summer of 2021, when the company released its latest report, Post leadership was also majority-male.
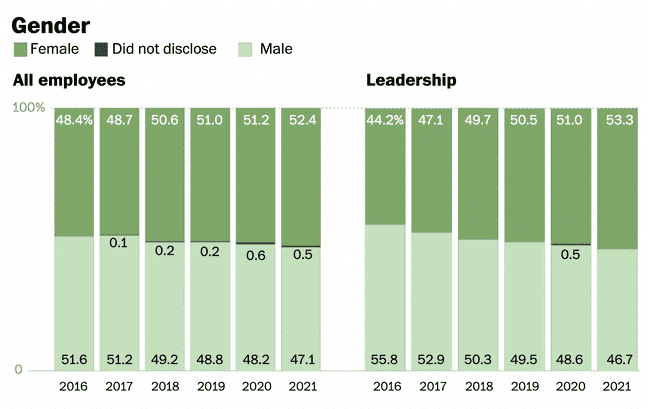
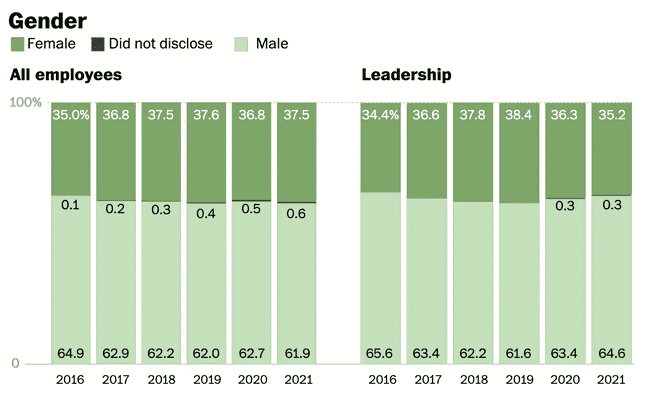
Across the company, the percentage of Post employees and Post leaders who identify as female has steadily increased over the past six years.
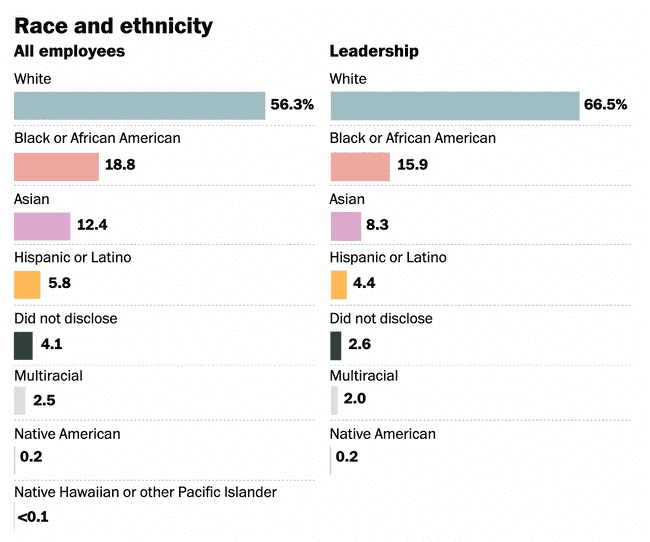
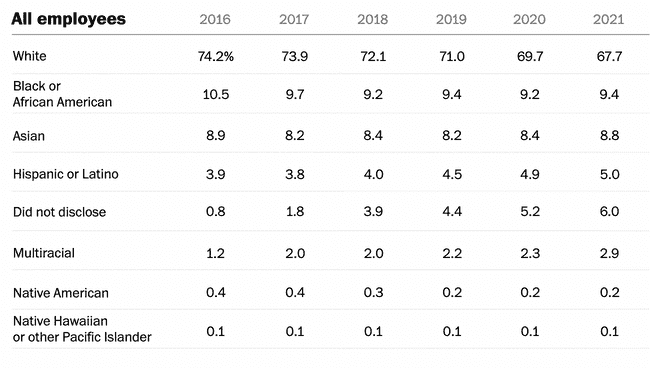
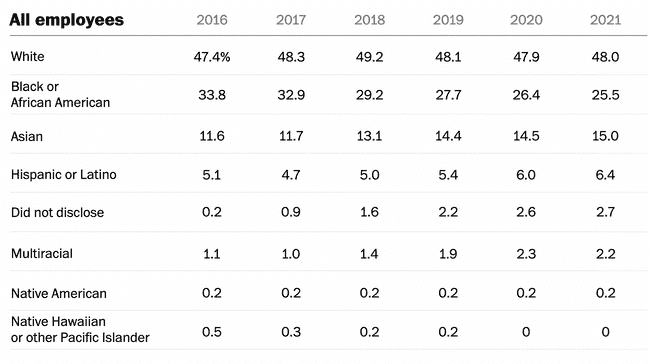
The Post’s demographic report on all employees broke down race and ethnicity data as follows:
 Source: Washington Post demographic report (2021)
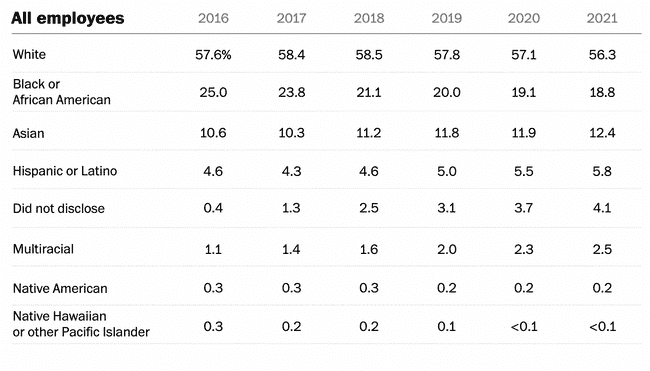
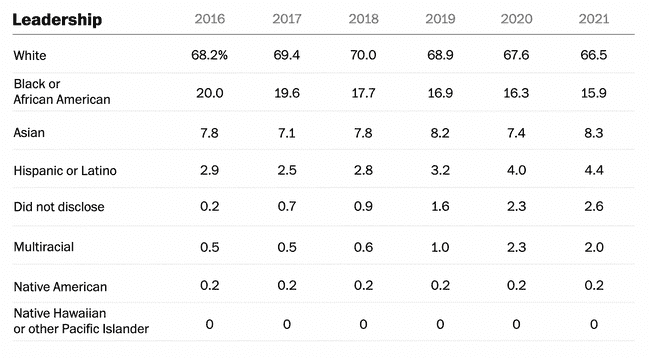
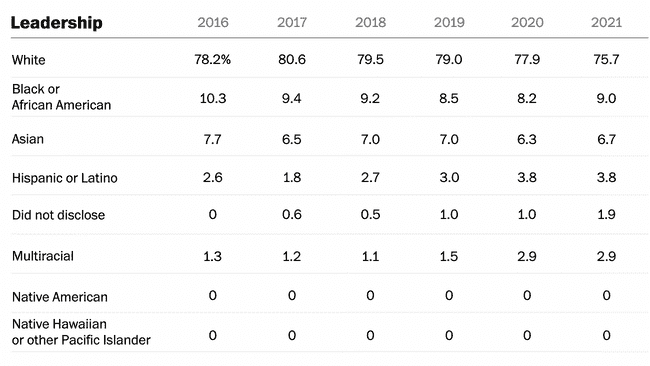
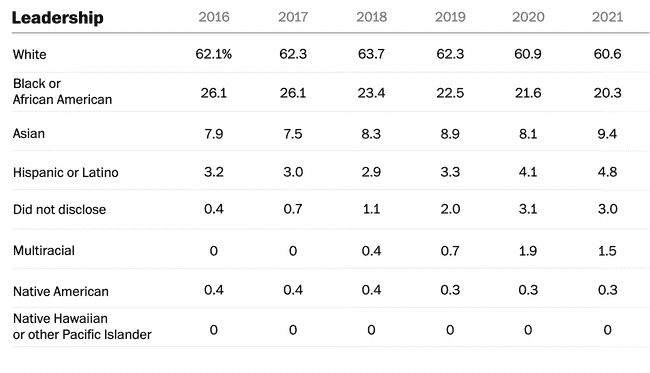
The company’s demographic report also showed change in employee demographics over time. Broadly speaking, even as The Post expanded its staff at a rapid rate from 2016 to 2021, the percentages of White employees and White leadership remained about the same (falling 1.3 and 1.7 percentage points, respectively).
 Source: Washington Post demographic report (2021)
 Source: Washington Post demographic report (2021)
For almost all other racial and ethnic groups, the percentages of employees and leaders identifying with those demographics grew slightly over the same time frame.
But according to the company’s data, the percentage of Black or African American (Black hereafter) employees at The Washington Post steadily declined from 2016 to 2021.
In 2016, Black employees made up 25 percent of the total workforce. By 2021, that figure had fallen to 18.8 percent. The share of leadership positions held by Black employees also decreased — from 20 percent in 2016 to 15.9 percent in 2021.
Pay
Overall, while pay disparities among Guild-covered employees still exist in the data provided by Post management, there are signs that things are moving in a positive direction. Company-wide gaps, as well as gaps among departments, are a bit smaller than they were when the Guild conducted this study in 2019.
Still, troubling inequities persist.
- When comparing median salaries, men made more than women even when controlling for factors such as job, section and years spent at the company.
- The same went for White employees compared with employees of color.
All Guild-covered salaried employees by gender
Men
361 employees
Women
421 employees
When examining pay at The Post, we used median salaries rather than mean, because very high or very low salaries can skew a mean. The median salary for Guild-covered women at The Post was 13 percent lower than that for Guild-covered men. The median hourly rate for Guild-covered women was 14 percent higher than that for men.
- Median salary for men: $114,921
- Median salary for women: $99,465
- Median hourly rate for men: $28
- Median hourly rate for women: $32
Among Guild-covered workers, White employees still made more on both salaried and hourly bases than employees of color, not taking into account factors such as experience or job type.
All Guild-covered salaried employees by race
White
525 employees
Black
76 employees
Asian
72 employees
Hispanic
47 employees
Multi-racial
21 employees
The median salary by race and ethnicity for salaried Guild-covered employees was as follows:
- White: $110,453
- Black: $95,000
- Asian: $94,920
- Hispanic or Latino: $94,780
- Two or more races: $90,000
Retention
While the company has made a commitment to diversity and fostering growth, the Guild wanted to see whether those pledges were being put into practice. The best way to measure that is through retention.
It is not enough for the company to hire employees from diverse backgrounds if it cannot retain them. The company must do more by not only providing pipelines for workers, especially young people of color and women, but also ensuring that there is equity and support for those employees as well.
We analyzed Guild data from 2016 to mid-2021, a period of rapid growth and increased hiring at The Post. The company shared the data with the Guild in two separate sets: “active” and “terminated” employment. The “active” data set showed the number of actively employed Guild-covered workers at the time of our request; and the “terminated” data set showed the number of Guild-covered employees who left The Post between early 2016 and mid-2021. In our analysis below, we refer to those from the “terminated” data set as employees who “departed” or “left” the company.
During our analysis, we found that one group of workers was missing from the data altogether: Guild-covered employees who left the Guild but stayed with the company, which can happen when someone is promoted into a Guild-exempt managerial position or moves into another part of the company that is not unionized, such as Engineering. This means that we were unable to include a small subset of formerly Guild-covered employees in our retention analysis. If the company had provided clearly defined data on those employees, we would have been able to determine the race and gender of the Guild-covered employees promoted into Post leadership during the time period of our analysis, a point of information worth exploring at a time when Post leadership remains majority-White and -male.
The only way for the Guild to analyze this information based on the company’s current categorization of employees would be to create our own rolling database of all employee salaries over time. Prior to this study, the internal Guild policy was to destroy the raw data sets after each analysis we conducted to ensure they could not be leaked or made public. This policy may be amended in order to improve our retention analysis in the future.
This is the first time the Guild has completed a comprehensive report on retention. We are not aware of any similar publicly released analysis by the company.
Retention by gender
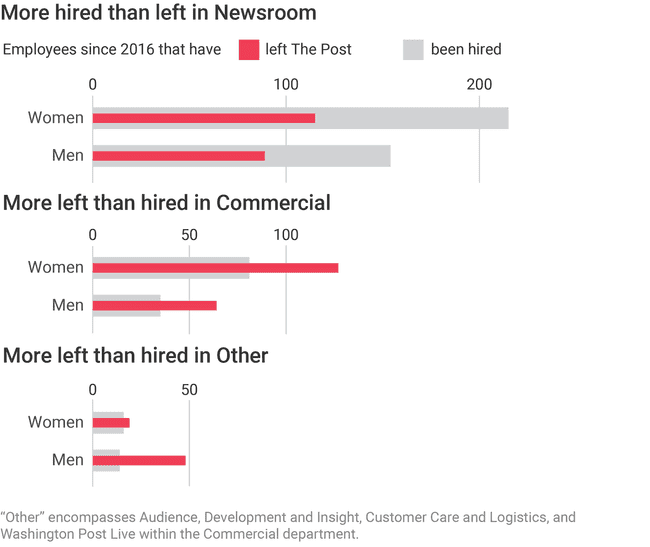
From 2016 to 2021, The Post hired more women than men across the company. Much of that growth happened in the Newsroom. The number of women in Commercial, on the other hand, dramatically shrank.
More than twice as many women as men in Commercial have departed. Our analysis showed that 2019 was a standout year for turnover among female staffers in Commercial, with nearly 40 women leaving The Post. This further exacerbated the gender imbalance in Commercial.
Retention by race and ethnicity
From 2016 to 2021, more workers of color left in Commercial than were hired, with the exception of Hispanic or Latino workers, whose numbers remained consistent. Demographic groups of fewer than five were excluded to protect individuals’ privacy.
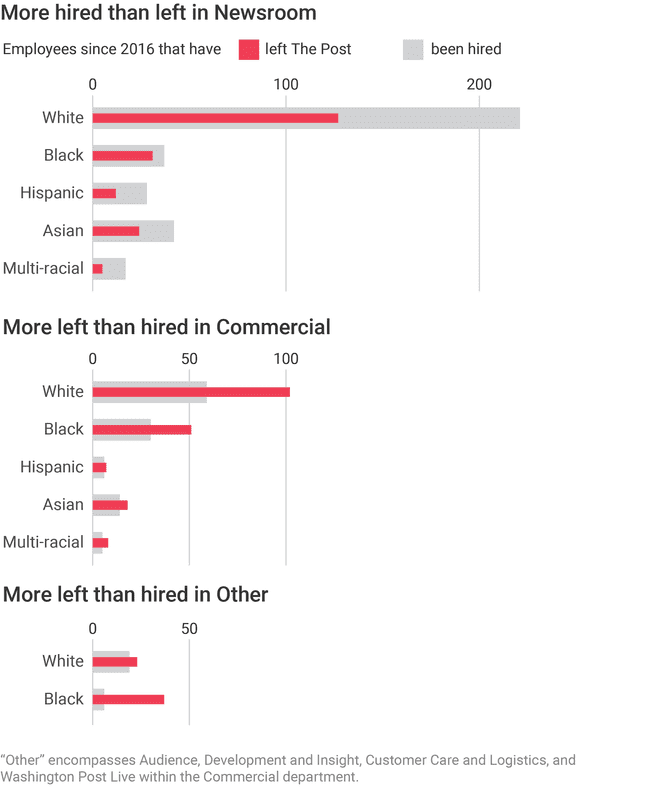
In the Newsroom, on the other hand, more workers were hired than left. For every employee who left, 1.8 employees were hired. However, that was not the case for Black employees. For every Black employee who left, only 1.2 Black employees were hired to replace them.
A deeper analysis of the data shows that in 2020 alone more than 1 out of 3 workers who left the Newsroom were Black. Fewer than 1 in 5 of those hired that year were Black.
This is further backed by the demographic report released by The Washington Post in 2021. It shows that while Black employees make up the second-largest racial group within the organization, this number has steadily declined since 2016.
This decline was most pronounced in Business — which includes Commercial — where the percentage of Black employees fell from 33.8 percent in 2016 to 25.5 percent in 2021, and the percentage of Black leadership decreased from 26.1 percent in 2016 to 20.3 percent in 2021.
Among all Newsroom employees and in leadership, the share of Black staffers declined by about one percentage point.
These percentages, along with the Guild’s data, suggest that The Post has a problem with retaining Black employees and Black leadership.
In the Newsroom, the data suggests that the company has made a concerted effort in recent years to hire more people of color. In 2017, only 17 percent of Newsroom hires were people of color. In 2020 and in the first half of 2021, however, they made up 52 percent of new hires.
Even so, the data shows that simply hiring more people of color has not made a significant impact on the overall diversity of Guild-covered Newsroom employees. Forty-five percent of Newsroom employees who left in 2020 and 2021 were people of color. This exit rate is far higher than the share of Guild-covered Newsroom employees who are people of color: 22 percent.
Retention by age
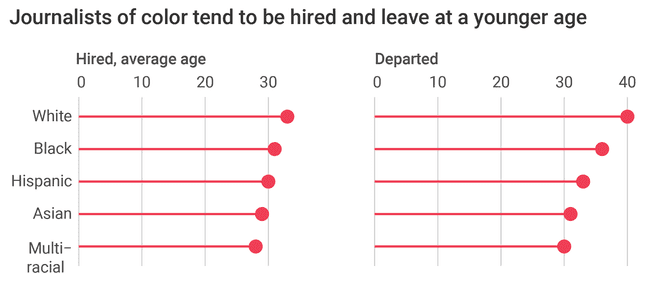
In the Newsroom, journalists of color were, on average, hired at a younger age than White workers. Asian employees and workers who are two or more races had the youngest median hiring ages at 27. White employees, on the other hand, had the oldest average and median hiring ages at 33 and 31, respectively. Average ages have been included for context because there were fewer outliers among ages compared with salaries.
From 2016 to 2021, the average and median ages at time of hiring were:
- White: 33 and 31
- Black: 31 and 30
- Asian: 29 and 27
- Hispanic or Latino: 30 and 29
- Two or more races: 28 and 27
This trend was also reflected in the ages at which people left the Newsroom, though the gap was larger. The difference between the average ages of White workers and Asian workers who left The Post was nine years.
From 2016 to 2021, the average and median ages when leaving the Newsroom were:
- White: 40 and 34
- Black: 36 and 32
- Asian: 31 and 31
- Hispanic or Latino: 33 and 30
- Two or more races: 30 and 32
On the Commercial side, Black employees tended to be hired at an older age than employees of other races and ethnicities, with average and median hiring ages of 39 and 42, respectively. Asian employees, meanwhile, had the youngest average and median hiring ages at 27 and 26, respectively.
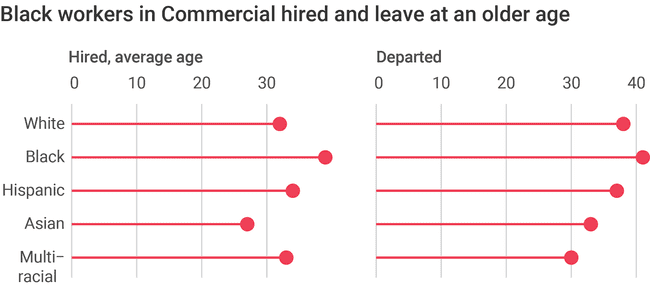
From 2016 to 2021, the average and median ages in Commercial at time of hiring were:
- White: 32 and 28
- Black: 39 and 42
- Asian: 27 and 26
- Hispanic or Latino: 34 and 28
- Two or more races: 33 and 31
This trend was similarly reflected in when workers left Commercial. Black employees tended to leave The Post at an older age, and Asian workers and employees of two or more races tended to be the youngest to leave.
From 2016 to 2021, the average and median ages when leaving Commercial were:
- White: 38 and 32
- Black: 41 and 41
- Asian: 33 and 32
- Hispanic or Latino: 37 and 33
- Two or more races: 30 and 28
Retention by department
Salaried employees
When accounting for retention by departments, the data reflects a hiring boom within the Newsroom over the past few years. On the whole, more employees were hired than left The Post.
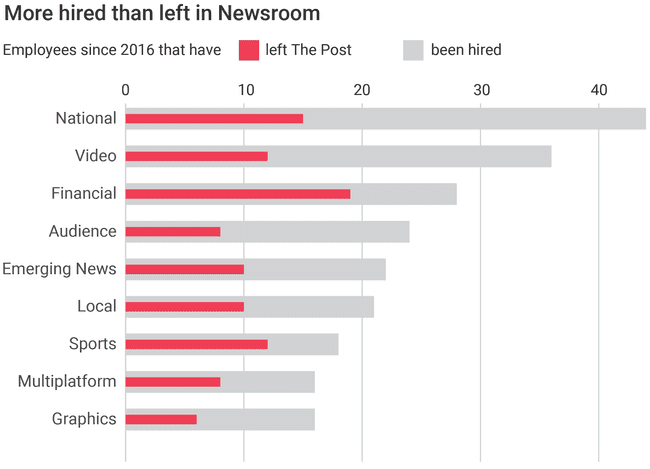
Conversely, more workers left Commercial than were hired. There was a 47 percent difference between the number of employees hired versus the number of employees who left.
Retention by section and race
Salaried employees
Breaking down retention by section and race paints an even more nuanced image of The Post workforce.
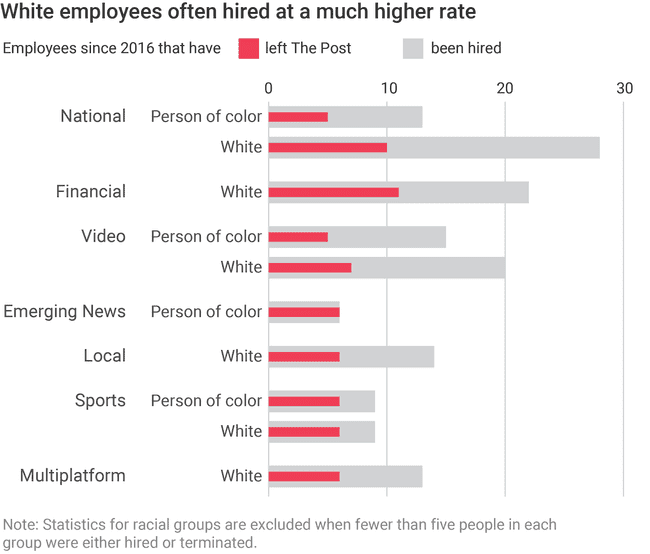
Within the Newsroom, White employees were often hired at a much higher rate than employees of color from 2016 to 2021. In some sections, fewer than five employees of color were hired and therefore couldn’t even be counted within the data in order to protect workers’ privacy. This was the case for Opinions, Financial and Multiplatform, where 11, 22 and 13 White employees, respectively, were hired from 2016 to 2021. Over that same time period, fewer than five employees of color were hired in each of those sections.
Within National, the number of White employees hired was more than double the number of employees of color hired. Yet White employees and employees of color left National at comparable rates — despite workers of color making up a smaller number of those hired and a smaller percentage of workers on the section overall.
Newsroom demographics and pay
As of mid-2021, the Washington Post Newsroom department employed just over 950 journalists. Of those workers, about 740 — or about three-fourths — were Guild-covered (non-managerial) employees.
In this section, we analyze the demographics of all Post journalists and the pay of Guild-covered Newsroom employees.
Demographics
Company-wide demographic data
In 2021, Sally Buzbee made history when she was hired as The Post’s first female executive editor in 143 years. Data from The Post’s publicly available demographic report shows that the Newsroom has become more female over the last five years. The Newsroom overall shifted from majority-male in 2016 (51.6 percent male) to majority-female in 2021 (52.4 percent female). Women also now make up the majority of Newsroom leadership at 53.3 percent, according to the company’s data. The company does not further parse the gender of people in different types of “leadership” jobs, such as high-level masthead positions, mid-level managers or entry-level editors.
 Source: Washington Post demographic report (2021)
When it comes to race and ethnicity, the 2021 company report showed that the Post Newsroom remained majority-White, at 67.7 percent. That share was down 6.5 percentage points from 2016. But over that time period, the percentage of people who did not disclose their race to the company rose by about the same rate.
The share of journalists who identify as Hispanic or Latino increased by about one percentage point during the five-year period in the company report. The share of people who identify as multiracial slightly increased. The share of Asian journalists held steady. But the share of Black journalists in the Newsroom — overall and in leadership — fell by about one percentage point.
 Source: Washington Post demographic report (2021)
 Source: Washington Post demographic report (2021)
Guild-covered demographic data
Within our Guild data, 67 percent of Guild-covered employees were White, and 28 percent were people of color. Salaried White male Newsroom employees outnumbered salaried White female Newsroom employees (229 to 207), but salaried women of color outnumbered salaried men of color in the Newsroom (109 to 72).
As a note, the data does not take into account employees who identify as nonbinary because The Post added that identification option only after the window of data provided.
Pay
In this section, we analyze the pay of Guild-covered employees using the data we requested from the company and are guaranteed under our union contract.
The Guild found that some pay gaps throughout the Newsroom have shrunk since our last pay study in 2019. Pay disparities between men and women, as well as between White journalists and journalists of color, have decreased by a few percentage points. However, our analysis shows that major disparities persist and the Newsroom is not close to parity in most ways.
This analysis found:
- Salaried men made more than women. The median salary for men was $120,977, compared with $102,700 for women, a gap of 18 percent.
- Women who are paid hourly made more than men. The median pay for women was $36 per hour, compared with $34 per hour for men.
- The disparity in median pay between men and women was starkest among employees under the age of 40, where there was a gap of 14 percent, amounting to nearly $13,000.
- White journalists made nearly 16 percent more than journalists of color. White journalists made a median salary of $113,810, while journalists of color had a median salary of $98,435.
- White men were paid more than any other group. This gap was particularly stark when comparing the median salaries for White men and women of color. White men had a median salary of $123,797, compared with a median salary of $94,840 for women of color. That gap was nearly $29,000 — or over 28 percent.
By gender
For the 320 salaried male Newsroom employees working at The Post, the median salary was $120,977. For the 336 salaried female Newsroom employees, it was $102,700.
The median age for salaried men working in the Newsroom was 42, compared with 36 for salaried women.
Newsroom salaried employees
Men
320 employees
Women
336 employees
For the 83 hourly employees across the Newsroom, there was also a slight difference. The median hourly wage for men was $34, compared with $36 for women. Comparing by age is difficult because only 33 men worked hourly jobs in the Newsroom and their ages varied widely. That said, female hourly workers (50) made more than male hourly workers. Under the age of 40, the gap was nearly $3, and over the age of 40, the gap was $10. However, the sample size for hourly workers was low, meaning a few employees could lower or raise the median fairly drastically.
Newsroom hourly employees
Women
50 employees
Men
33 employees
By age
When adjusting for similar age groups, which in most cases is the best stand-in for years of experience in journalism, it becomes clear that the pay disparity between men and women was starkest among employees under the age of 40.
- Over the age of 40: There were nearly 1.4 men for every woman in the Newsroom. Their median salary was 2.4 percent more, a gap of over $3,000.
- Under the age of 40: There were nearly 1.5 women for every man in the Newsroom. Their median salary was 12.5 percent less, a gap of nearly $13,000.
Newsroom salaried employees by age
25 to 34
217 employees
35 to 44
189 employees
45 to 54
121 employees
55 to 64
96 employees
Over 65
18 employees
When looking at this in the context of race and ethnicity, we also found disparities. Among those under 40, Newsroom employees of color made about 4 percent less than their White counterparts, with median salaries of $92,000 and $96,000, respectively.
The race disparity widened for journalists 40 and over. Newsroom employees of color had a median salary of $121,875, while their White colleagues had a median salary of $130,800 — a gap of more than 7 percent.
From 2016 to 2021, younger women at the organization were more diverse — 55 percent of women under 40 were women of color, whereas only 27 percent of women over 40 were women of color. For men under 40, 44 percent were journalists of color, and for men over 40, 24 percent were journalists of color.
By race and ethnicity
In the Newsroom, 67 percent of Guild-eligible employees were White and 28 percent of Guild-eligible employees were people of color.
Below are the median salaries by race and ethnicity across the Newsroom:
- White: $113,810
- Black: $102,700
- Asian: $103,970
- Hispanic or Latino: $95,780
- Two or more races: $91,090
Newsroom salaried employees by race
White
437 employees
Asian
59 employees
Black
60 employees
Hispanic
42 employees
Multi-racial
18 employees
The gap between White journalists in the Newsroom and journalists of color was nearly 16 percent, with a median salary of $113,810 for 437 White journalists and $98,435 for 181 journalists of color.
About 58 of the hourly employees in the Newsroom were White — and they made a median wage of $35 an hour compared with $34 for hourly employees of color.
By gender, race and ethnicity
We would be remiss if this study did not examine gender, race and ethnicity through an intersectional lens. Across most industries, disparities increase when multiple factors are taken into account. Our analysis shows a similar pattern.
The median salaries by group were as follows:
- White men: $123,797
- Men of color: $104,420
- White women: $105,780
- Women of color: $94,840
Newsroom salaried employees
White men
229 employees
Asian men
16 employees
Black men
29 employees
White women
207 employees
Hispanic men
21 employees
Asian women
43 employees
Black women
31 employees
Hispanic women
21 employees
Multi-racial women
13 employees
Multi-racial men
5 employees
The gender pay gap was fairly similar across races and ethnicities. White men made about 19 percent more than White women, and men of color made 12 percent more than women of color across the Newsroom.
Likewise, racial pay gaps were similar across genders, with White men making about 17 percent more than men of color and White women making 10 percent more than women of color.
When comparing median pay for White men and women of color across the Newsroom, the gap was over 28 percent — or nearly $29,000. Some of this may be attributed to the fact that White men working at The Post had the oldest median age of any group across the Newsroom.
Median ages by group were as follows:
- White men: 43
- Men of color: 40
- White women: 37
- Women of color: 33
The Post underpays men and women of color relative to White men. Controlling for age, here is how the median salaries for the four groups in the Newsroom stacked up:
- White men were paid an average of 4 percent higher than the median for their age group
- Men of color were paid an average of 4 percent lower than the median for their age group
- Women of color were paid an average of 4 percent lower than the median for their age group
- White women were paid on average about the median for their age group
By section
We also examined whether disparities existed within Newsroom sections. But many sections are not captured in the analysis because they are too small to evaluate.
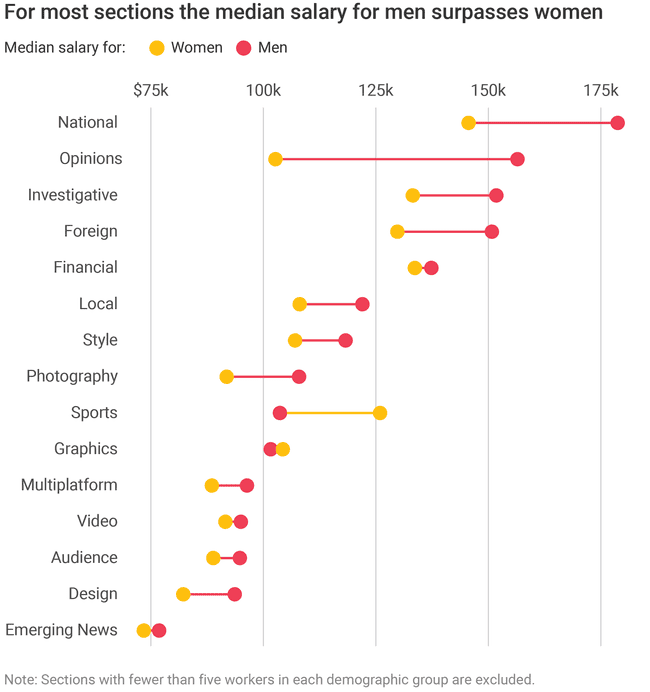
Of the 15 sections that had at least five men and five women:
- In 10 sections, men had higher median pay than women (beyond 5 percent): Audience, Design, Foreign, Investigative, Local, Multiplatform, National, Opinions, Photography and Style.
- One section, Sports, had a median pay disparity that favored women by 18 percent.
- In four sections, there was approximate pay equity between genders (within 5 percent): Emerging News Products, Financial, Graphics and Video.
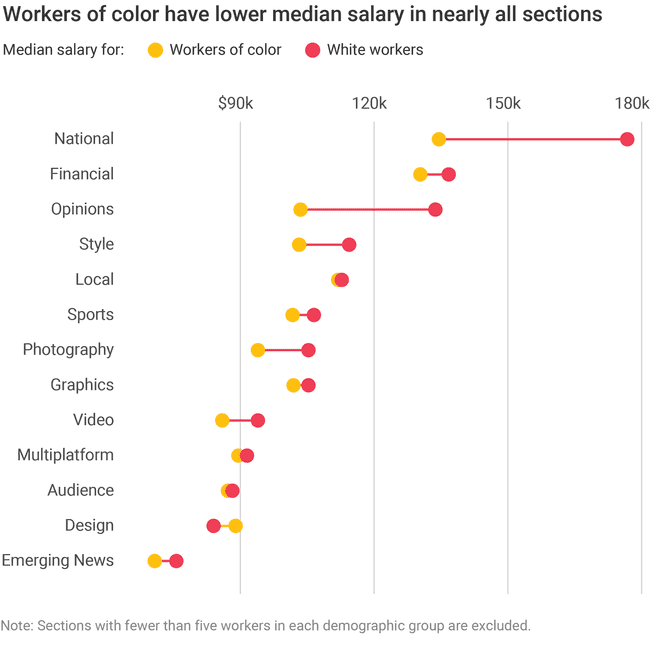
Of 13 sections for which there were at least five White journalists and five journalists of color:
- Six sections had a median pay disparity favoring White employees of more than 7 percent: Opinions, Emerging News Products, Video, Style, Photography and National.
- Seven sections had approximate pay equity (within 5 percent) between journalists of color and White journalists: Audience, Design, Financial, Graphics, Local, Multiplatform and Sports.
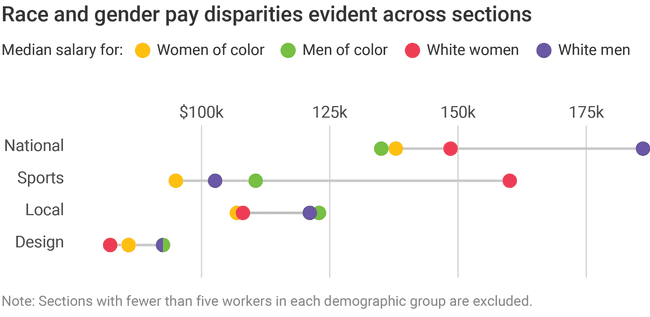
There were only four sections that had at least five White men, five White women, five men of color and five women of color: Design, Local, National and Sports.
- All four sections had racial and gender pay disparities.
- For employees across these four sections, the disparity in median salaries between White men and women of color was 8 percent.
- The starkest gaps in median salaries were between White men and men of color in National ($51,000) and between White women and women of color in Sports ($65,000).
- The majority of sections in the Newsroom did not have enough staff diversity for us to analyze pay along race and gender lines. Those sections include: Audience, Audio, Opinions, Emerging News Products, Financial, Foreign, Graphics, Investigative, Multiplatform, News Content & Research, News Logistics, non-Newsroom (which includes Client Solutions, Marketing, Washington Post Live, and others), Operations, Outlook, Polling, Photography, Style, Universal, Video and other ungrouped employees.
One prominent factor in the pay disparities is that sections with higher median salaries also had higher shares of male and White journalists.
Across sections in which employees’ median salary was higher than $125,000 (including National, Investigative, Foreign, Financial and Opinions):
- 67 percent of employees were White and 55 percent of employees were male.
- 40 percent of employees were White men, 27 percent were White women, 12 percent were women of color, and 8 percent were men of color (the rest did not indicate race).
Across sections where the median salary was below $125,000:
- 67 percent of journalists were White and 45 percent of journalists were male.
- 34 percent of journalists were White women, 32 percent were White men, 19 percent were women of color, and 12 percent were men of color.
The journalists in the highest-paid sections were predominantly White and male, while there were more women and journalists of color in sections with lower median salaries.
Raises and Performance Evaluations
In the first quarter of every calendar year, The Post awards a portion of employees what it calls “merit” raises. These raises, by company definition, are based upon performance and given out after annual evaluations, which rate employees on a scale of 1 to 5 — with a 3 defined as “meets expectations.” The Post contends that merit raises are tied mostly to performances.
The data bears that out. Those who scored higher, regardless of race, ethnicity or gender, tended to be the ones who got merit raises most frequently.
However, an analysis of every performance evaluation score between 2016 and 2021 shows that those who scored the highest were overwhelmingly White.
In cases in which salaried Newsroom employees were given an overall rating of 4 or higher, 84 percent of those journalists were White and just 11 percent were journalists of color, which is disproportionate to the demographics of the Newsroom. And in cases in which salaried Newsroom employees were given a score of 3 or below, 35 percent were employees of color.
Since 2015, men have received a higher percentage of merit pay raises than women, despite accounting for a smaller proportion of the Newsroom. The Newsroom’s gender makeup was 45 percent male and 54 percent female, yet men received 55 percent of merit raises and women received 45 percent.
As a result, the Newsroom’s highest earners — White men — were likeliest to have their pay inflated through merit raises.
But those who experience the greatest pay inequity — women and people of color — were more likely to have their pay increased through a different raise classification altogether.
The Guild’s analysis found that there is another category of raise, called a “market adjustment,” which the company defines as one that brings an employee’s pay in line with market rates — either because they are underpaid in comparison to their colleagues or because they have received a competing job offer. While these types of raises are given throughout the calendar year, the Guild analysis found that many of them are concentrated in early April, which is when annual merit raises are announced.
About 82 percent of the raises given during merit raise season are true merit raises and labeled as such in the data. Most of the remaining raises given during this time period are labeled as market adjustments, which the company funds through a separate pool of money. However, the company told the Guild that all raises given in April should be considered merit raises, even those it characterizes in its own data as market adjustments. According to the company, its labeling of “merit” raises and “market adjustment” raises during merit raise season depends on the percentage by which an employee's pay is increased. Generally, it labels a raise of less than 5 percent a merit raise and categorizes one that exceeds 5 percent as a market adjustment raise. Notably, our analysis shows that the amount of money given to employees in April as a market adjustment is a higher sum than the amount of money given out in merit raises. The median market adjustment is more than double the median amount of money given as a merit raise. From 2015 to 2017, 41 percent of company-wide market adjustments were given on April 1. From 2019 to 2021, the share of market adjustments given on April 1 rose to 79 percent. It’s worth noting that the increase in the share of market adjustments handed out in April generally reflects a similar increase in the number of merit raises being given to employees — something the company has said is evidence of its financial health.
Further, our analysis shows that of the market adjustments given out on April 1 from 2015 to 2021 across the company:
- 71 percent went to White employees
- 66 percent went to women
- 44 percent went to White women
- 29 percent went to employees of color
Within the Newsroom:
- 70 percent went to White employees
- 64 percent went to women
- 42 percent went to White women
- 30 percent went to employees of color
- 21 percent went to women of color
- 8 percent went to men of color
Those percentages are disproportionate to the racial and gender breakdown of Post employees as a whole and Guild-covered Newsroom employees.
While Commercial employees also received market adjustments, the numbers are too small for us to draw conclusions.
An employee can determine whether their raises have been labeled as merit or market adjustment by looking under View Profile > Compensation > Pay Change History in their Workday profile. Even still, “market adjustment” raises that come during April’s “merit” raise season will still be categorized as “merit” raises in Workday’s separate “My Merit Statement History” tab under “Pay.”
This contradictory categorization is confusing and misleading for employees, conflating a true “merit” raise based on performance with an equity adjustment based on fairness. We explore this further in our Recommendations section.
Because the majority of raises that come after performance evaluations are “merit” raises as defined in the data, the Guild decided to analyze in greater detail the ways in which performance evaluation scores compare with how the company distributes “merit” raises.
From 2015 to 2021, the median performance ratings by race/ethnicity for salaried journalists were as follows:
- White: 3.5
- Black: 3.3
- Asian: 3.4
- Hispanic or Latino: 3.4
- All others: 3.4
For Black and Asian journalists, there is relatively little difference in the evaluation scores between those who currently work in the Post Newsroom and those who have left.
| Race | Female median eval active | Male median eval active | Female median eval departed | Male median eval departed |
|---|---|---|---|---|
| White | 3.5 | 3.6 | 3.4 | 3.3 |
| Black | 3.3 | 3.3 | 3.3 | 3.2 |
| Asian | 3.4 | 3.4 | 3.4 | 3.3 |
| Hispanic or Latino | 3.4 | 3.4 | 3.1 | 3.2 |
| All others | 3.5 | 3.5 | 3.55 | 3.1 |
Since 2018, before the first Guild pay study came out, evaluation scores for all races generally increased between 0.05 and 0.1 points. The exception was Black Newsroom employees, who saw their median score increase from 3.3 to 3.5.
From 2015 to 2021, the percentages of merit raises distributed by race and ethnicity for salaried journalists were as follows (averages are used here because merit raises had a fairly basic range with minimal outliers):
- White: 76 percent (average raise of $3,080)
- Black: 9 percent (average raise of $2,500)
- Asian: 7 percent (average raise of $2,800)
- Hispanic or Latino: 5 percent (average raise of $2,700)
- All others (includes those who did not disclose): 4 percent (average raise of $2,900)
For contrast, over that time the racial and ethnic makeup of salaried journalists was as follows:
- White: 67 percent
- Black: 9 percent
- Asian: 9 percent
- Hispanic or Latino: 6 percent
- All others: 9 percent
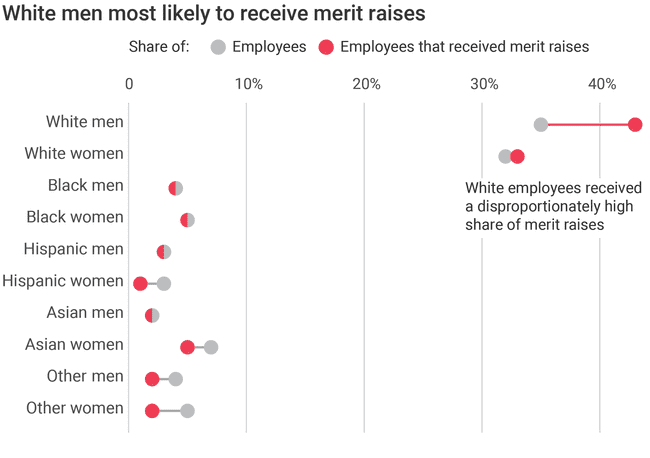
Merit raises went to these groups in the following percentages, compared to the percentages of the Newsroom they make up:
- White men: 43 percent of merit raises vs. 35 percent of Newsroom employees
- White women: 33 percent of merit raises vs. 32 percent of Newsroom employees
- Black men: 4 percent of merit raises vs. 4 percent of Newsroom employees
- Black women: 5 percent of merit raises vs. 5 percent of Newsroom employees
- Asian men: 2 percent of merit raises vs. 2 percent of Newsroom employees
- Asian women: 5 percent of merit raises vs. 7 percent of Newsroom employees
- Hispanic or Latino men: 3 percent of merit raises vs. 3 percent of Newsroom employees
- Hispanic or Latina women: 1 percent of merit raises vs. 3 percent of Newsroom employees
- Other men: 2 percent of merit raises vs. 4 percent of Newsroom employees
- Other women: 2 percent of merit raises vs. 5 percent of Newsroom employees
Commercial demographics and pay
As of 2021, about a quarter of Guild-covered employees worked on the Commercial side of The Post, which includes Finance, Client Solutions, Production and PR-Consuming Marketing. The following analysis of the organization’s Commercial side includes a base of 263 Guild-covered employees within that division.
Demographics
According to the company’s own demographic report, the percentage of Guild and non-Guild Black employees in Business — which includes Commercial — has steadily shrunk over the last five years.
In 2016, Black employees made up 33.8 percent of Business. Yet by 2021, this percentage decreased to 25.5 percent.
 Source: Washington Post demographic report (2021)
 Source: Washington Post demographic report (2021)
The only other racial group to see a decrease in representation was Native Hawaiians or other Pacific Islanders. In comparison, White, Asian, Hispanic/Latino, Native American and multiracial employees either held steady or saw a small increase in representation across Business.
These trends were reflected in Business leadership as well. Black employees made up 26.1 percent of Business leadership in 2016, but by 2021 they made up only 20.3 percent.
While Business appeared to have made small steps toward gender equity, men still vastly outnumbered women in 2021. According to The Post’s demographic report, women made up 37.5 percent of Business. Men, on the other hand, were nearly double that at 61.9 percent.
 Source: Washington Post demographic report (2021)
This gender gap was reflected in the makeup of Business leadership, which was 35.2 percent female and 64.6 percent male.
Pay
Since our last study, Commercial has taken modest steps toward raising the median salary for Guild-covered female employees and bumping up the median wage for Guild-covered hourly employees. However, there are many areas where disparities actually grew since the last study.
Among Guild-covered employees, this year’s analysis found:
- Not only were White employees paid more than employees of color, but that disparity also grew significantly since our last study, from a median salary difference of $4,555 to $17,600.
- Women made more than men in Commercial, yet left at a higher rate.
By race and ethnicity
For the 73 salaried employees on Commercial who were White, the median salary increased from $88,000 to $97,600 since our last study. But for the 32 employees of color working alongside them, the median salary decreased from $83,445 to $80,000, widening the pay disparity between the two groups significantly from $4,555 to $17,600.
Commerical salaried employees
White
73 employees
Black
14 employees
Asian
13 employees
While hourly employees saw a modest bump in their median pay since our last study, White employees were still paid more than employees of color.
For the 35 hourly employees in Commercial who were White, the median hourly rate was $32; for the 82 employees of color working alongside them, the median hourly rate was $28.80 — a disparity of more than 10 percent.
Commerical hourly employees
White
35 employees
Asian
8 employees
Black
64 employees
By gender
In 2019, our study showed that gender pay disparities were nearly nonexistent.
Since then, the women in Commercial have seen a small bump in their salary, putting them above men. For the 31 salaried men working in Commercial, the median salary was $89,300; for the 75 women, it was $93,000.
Commerical salaried employees
Women
75 employees
Men
31 employees
Among hourly employees, women’s median hourly pay was $32.05 and men’s was $26.81.
Commerical hourly employees
Women
61 employees
Men
57 employees
Yet, according to our retention data, women in Commercial are leaving at higher rates than men. This suggests that pay alone is not enough to retain talent. There needs to also be a built-in support system and clear avenues of growth for employees.
Salary by gender, race and ethnicity
Even though women as a whole made more than men in Commercial, examining race and ethnicity alongside gender reveals that those gains were not distributed equitably among women.
The 58 salaried White women in Commercial had a median salary that was 2.5 percent higher than that of the eight Black women and 20 percent higher than that of the eight Asian women. There were too few Hispanic or Latina women for an analysis.
The pay disparity between White men and men of color in Commercial was stark as well. For the 20 White men, the median salary was $93,800; for the six Black men, it was $85,500.
Commerical salaried employees
White women
54 employees
White men
19 employees
Black men
6 employees
Black women
8 employees
Asian women
8 employees
Asian men
5 employees
A different trend emerges among hourly employees.
In Commercial, the biggest gap among hourly employees was between White women and men of color. The median hourly rate for the 19 White women was $34, whereas the median for the 34 Black men was $26, a 26 percent disparity.
On the other hand, the gap between White men and women of color was almost nonexistent. The median hourly rate for the 16 White men in Commercial was $28, while for the 30 Black women and the five Asian women, median hourly pay was $30 and $29, respectively. There were too few Hispanic or Latino men for an analysis.
Commerical hourly employees
White women
19 employees
Black women
30 employees
Asian women
5 employees
White men
16 employees
Black men
34 employees
Salary by age
When accounting for age, the disparity in median pay appeared especially pronounced between Black men and White men.
The median ages for salaried employees were as follows:
- White: 37
- Black: 48.5
- Asian: 32
- Hispanic or Latino: 43
For the 29 White salaried employees over 40, the median pay was $107,453, but for the 14 salaried employees of color over 40, the median pay was $85,573. For the 43 White salaried employees under 40, the median income was $95,000, and for the 17 employees of color under 40, the median income was $78,500.
The median income for salaried employees over 40:
- White: $107,453
- People of color: $85,573
The median income for salaried employees under 40:
- White: $95,000
- People of color: $78,500
For hourly Commercial employees under 40, they were paid as follows:
The median hourly pay for employees under 40:
- White: $35.90/hour
- People of color: $30.19/hour
The median hourly pay for employees over 40:
- White: $30.20/hour
- People of color: $26.80/hour
One of the issues with attempting to determine disparities across Commercial is that the data does not allow us to determine how many hours an employee works. The data distinguishes between full- and part-time hourly employees, but does not count how many hours part-time employees work (which would be difficult, because of the fluidity of many part-time schedules).
Raises and Performance Evaluations
As explained earlier in the report, in the first quarter of every calendar year The Post awards a portion of employees what it calls “merit” raises. These raises, by company definition, are based upon performance and given out after annual performance evaluations, which rate employees on a scale of 1 to 5 — with a 3 defined as “meets expectations.” The Post contends that merit raises are tied mostly to performance evaluations.
An analysis of raises for The Post’s Commercial employees shows that White employees typically received higher merit raises than their colleagues of color from 2016 to 2021. The most common type of raise among Commercial employees, with the exception of those mandated by the Guild contract, was merit raises.
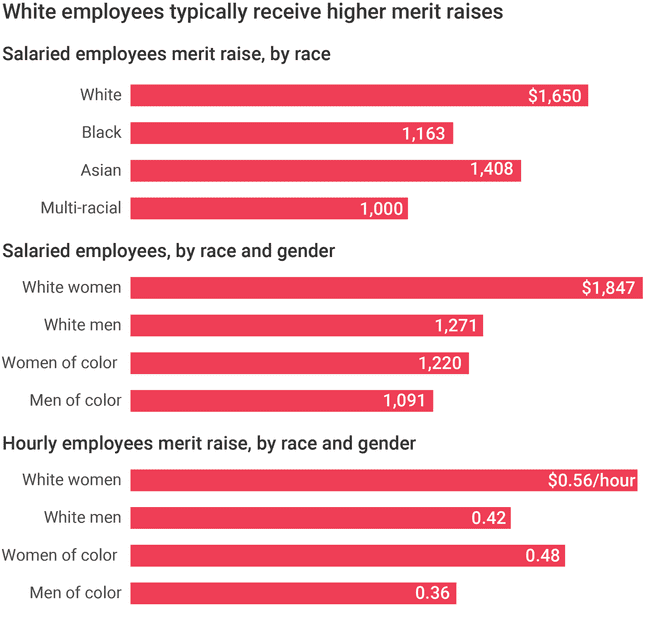
The median merit raises for salaried employees were as follows:
- White: $1,650
- Asian: $1,408
- Black: $1,163
- Employees of two or more races: $1,000
When accounting for race and gender, the median merit raises were as follows:
- White men: $1,271
- White women: $1,847
- Men of color: $1,091
- Women of color: $1,220
The median merit raises for hourly employees were as follows:
- White men: 42 cents/hour
- White women: 56 cents/hour
- Men of color: 36 cents/hour
- Women of color: 48 cents/hour